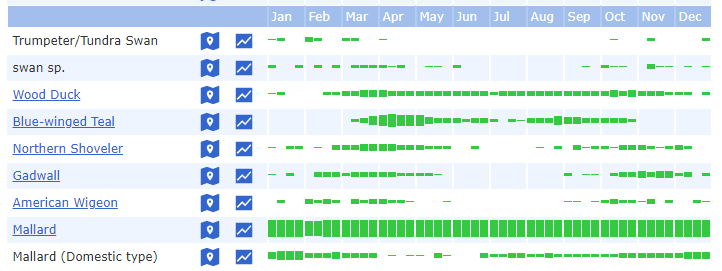
eBird bar chart screenshot for Montrose Point (click to see the larger version)
Among the many features eBird has to offer, one of the most useful is the ability to view bar charts for a given hotspot. These bar charts make it easy to see monthly status information for all the species eBird has records of for a hotspot. To pull up an eBird bar chart
- Go to an eBird hotspot
- In the pale blue sidebar on the left side of the page, click the Bar Charts link under the EXPLORE heading (the graphic below is a screenshot of this section).

That’s it. The chart may take a few seconds to completely load, so be patient. Try it for Montrose Point and see what comes up.