Hawk Migration Charts
Corrections to the Meadowlark article "Five years of hawkwatching at Illinois Beach State Park: where are we now?"
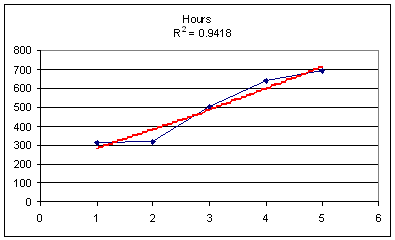
Figure 3 (above): Total hours per year. The trend in this case is significantly upwards, although it will probably level off in the future.
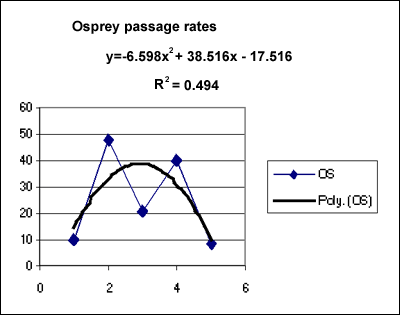
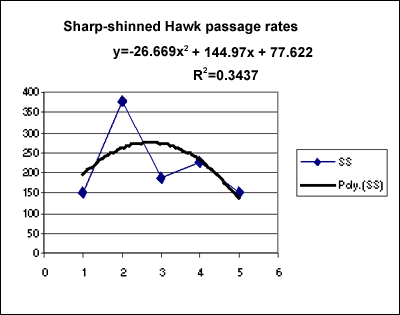
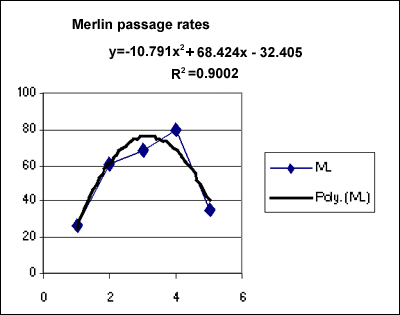
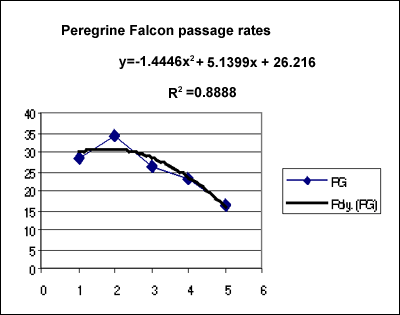
Figure 4 (above): Yearly passage rates (birds/100 hours) for the following species: Osprey, Sharp-shinned Hawk, Merlin, and Peregrine Falcon. Trend lines are not significant.
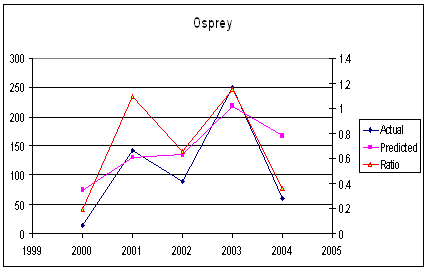
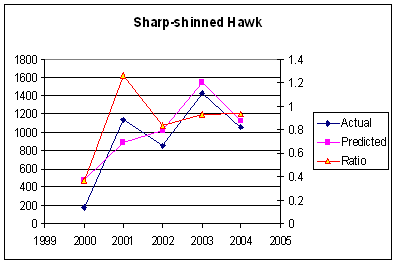
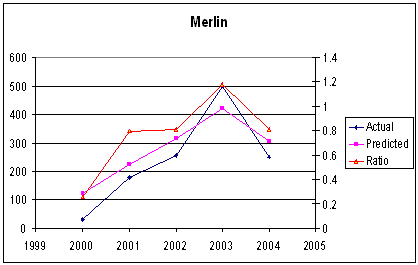
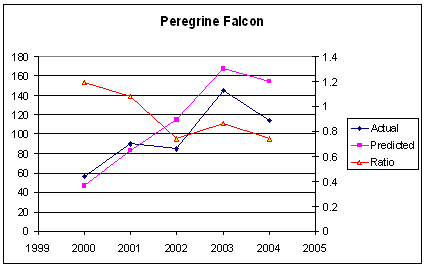
Figure 5 (above): Yearly totals, predicted totals, and the ratio between the two for the following species: Osprey, Sharp-shinned Hawk, Merlin, and Peregrine Falcon. Ratio values well below 1 may indicate a declining population.
Hawk Migration Charts
Return to IOS Publications & Meadowlark Archives